About Technical Analysis
Stock market technical analysis in intraday, daily, weekly and monthly timeframes for stocks, ETFs and Indexes. Trend analysis identifies the price movement trends using pivot points (peaks and troughs). It also gives...
Stock market technical analysis in intraday, daily, weekly and monthly timeframes for stocks, ETFs and Indexes.
Trend analysis identifies the price movement trends using pivot points (peaks and troughs). It also gives price levels to watch out for trend reversals and changes in the future.
Support and resistance analysis identifies support resistance levels using moving averages, pivot points, pricing patterns and gaps. It also gives quantitative description of the support and resistance strength based on the analyzing of volumes and occurrences.
Up/down volume analysis identifies accumulation or distribution conditions using the A/D ratio.
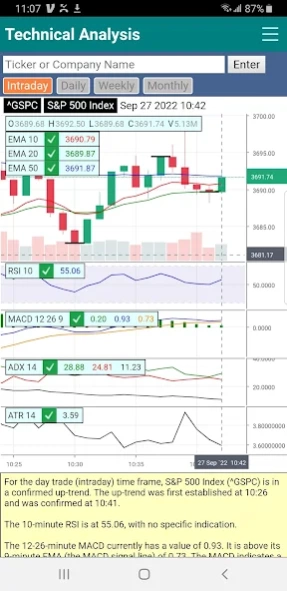
Traditional technical analysis include RSI, MACD, ADX, Bollinger Bands and ATR indicators.
For RSI, it identifies overbought and oversold conditions in a range-bound (non-trending) market. In a trending market, it signals trend reversal by looking for divergences between the movements of pricing and the indicator.
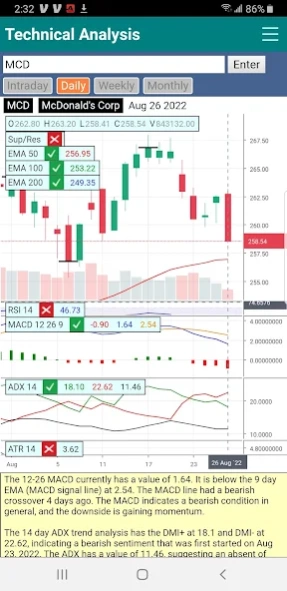
For MACD, it describes bullish or bearish sentiment with pricing momentum and gives alerts of bullish and bearish crossover in the signal line.
For the ADX indicator, it interprets trend strength and direction based on DMI+, DMI- and ADX lines.
Bollinger bands analyzer (new for version 5) interprets the current pricing positions against the bands. It also analyzes the %b value against historical volatility for the band to be in the squeeze or bulge conditions to identify the beginning or the end of a movement.
The ATR analysis indicates volatility of pricing changes to find profitable entry and exit levels of trades.
Candlestick analyzer finds candlestick patterns.
Daily summary analysis compares price performance of a security against the general market as well as other securities in its own industry. The volume strength measures the trading volume against its own recent average volume at the same time fraction during a trading day. High volume strength can be used to confirm price movements and low volume strength signals the lack of conviction of the changes.
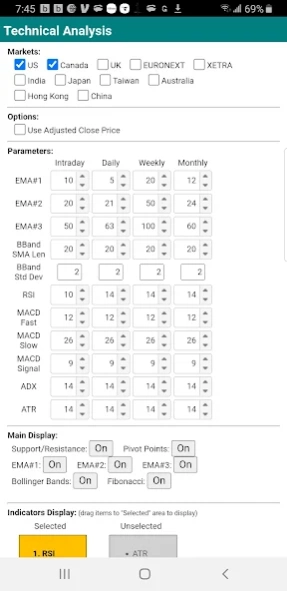
The parameters for moving averages and indicators are fully customizable for each timeframe.
Other than the USA and Canadian (TSX) markets, the app also supports UK (LSE), Europe (EURONEXT and XETRA), India (NSE), Japan (XTKS, XFKA and XSAP), Taiwan (XTAI and ROCO), Australia (ASX), Hong Kong (XHKG) and China (XSHE and XSHG) markets.
Version 4.5 and later include the option of using Adjusted Close Price. Adjusted close is the closing price after adjustments for all applicable splits and dividend distributions. Data is adjusted using appropriate split and dividend multipliers, adhering to Center for Research in Security Prices (CRSP) standards.
Previous Versions
Here you can find the changelog of Technical Analysis since it was posted on our website on 2022-06-02 14:43:10.
The latest version is 5.0.3 and it was updated on 2024-04-19 17:51:50. See below the changes in each version.
Technical Analysis version 5.0.3
Updated At: 2023-10-21
Changes: .Add Bollinger Bands indicators and Bollinger Band analysis.
.Add daily price gain strength and volume strength analysis (on daily timeframe only).
.Add Up/Down volume analysis.
.Add candlestick pattern analysis.
.Improved trend analysis with price levels for early lookout of trend changes.
.Include options to turn on/off pivot points and Fibonacci lines on the main chart.
Technical Analysis version 4.5.0
Updated At: 2023-05-16
Changes: Add the option of using Adjusted Close Price. Adjusted close is the closing price after adjustments for all applicable splits and dividend distributions. Data is adjusted using appropriate split and dividend multipliers, adhering to Center for Research in Security Prices (CRSP) standards.
Technical Analysis version 4.3.0
Updated At: 2023-04-27
Changes: Add supports for new stock markets – Japan (XFKA, XSAP and XTKS), Taiwan (ROCK and XTAI), Australia (XASX), Hong Kong (XHKG) and China (XSHE and XSHG).
Technical Analysis version 4.2.1
Updated At: 2023-04-24
Changes: Add supports for India (NSE), UK (LSE) and other Europe stock markets (EURONEXT and XETRA).
Technical Analysis version 4.1.0
Updated At: 2023-03-27
Changes: .Displays latest Open High Low Close Changes and Volume numbers with color in each time frame.
.Text fonts and side bar space adjustments for optimal use of canvas space.
Technical Analysis version 2.0.0
Updated At: 2022-02-05
Changes: .Add support resistance analysis, including support and resistance from pivot points, gaps, and major moving averages.
.Support and resistance levels includes information of prices, strength, volume strength and other data and analysis information helping determine of possible price movements.
Disclaimer
Official Google Play Link
We do not host Technical Analysis on our servers. We did not scan it for viruses, adware, spyware or other type of malware. This app is hosted by Google and passed their terms and conditions to be listed there. We recommend caution when installing it.
The Google Play link for Technical Analysis is provided to you by apps112.com without any warranties, representations or guarantees of any kind, so access it at your own risk.
If you have questions regarding this particular app contact the publisher directly. For questions about the functionalities of apps112.com contact us.